Development of an Interactive Dashboard for Football Analysis
-
 © Medhiratta
Football Analysis is being done currently at a large scale in all big Football Clubs to improve the performance and results of the Club and Players by analyzing performance metrics. This project focuses on the creation of an interactive football dashboard including information on different confederations (e.g. Europe), competitions (e.g. Bundesliga), clubs (e.g. RB Leipzig), games, players, and events (e.g. goals or assists). The developed dashboard allows to analyze exemplary data for a specific season and top leagues from European countries. The data was prepared and transformed to ensure it was suitable for analysis, and stored in relational tables within a PostgreSQL database to facilitate efficient data retrieval and management, crucial for the subsequent visualization phase.
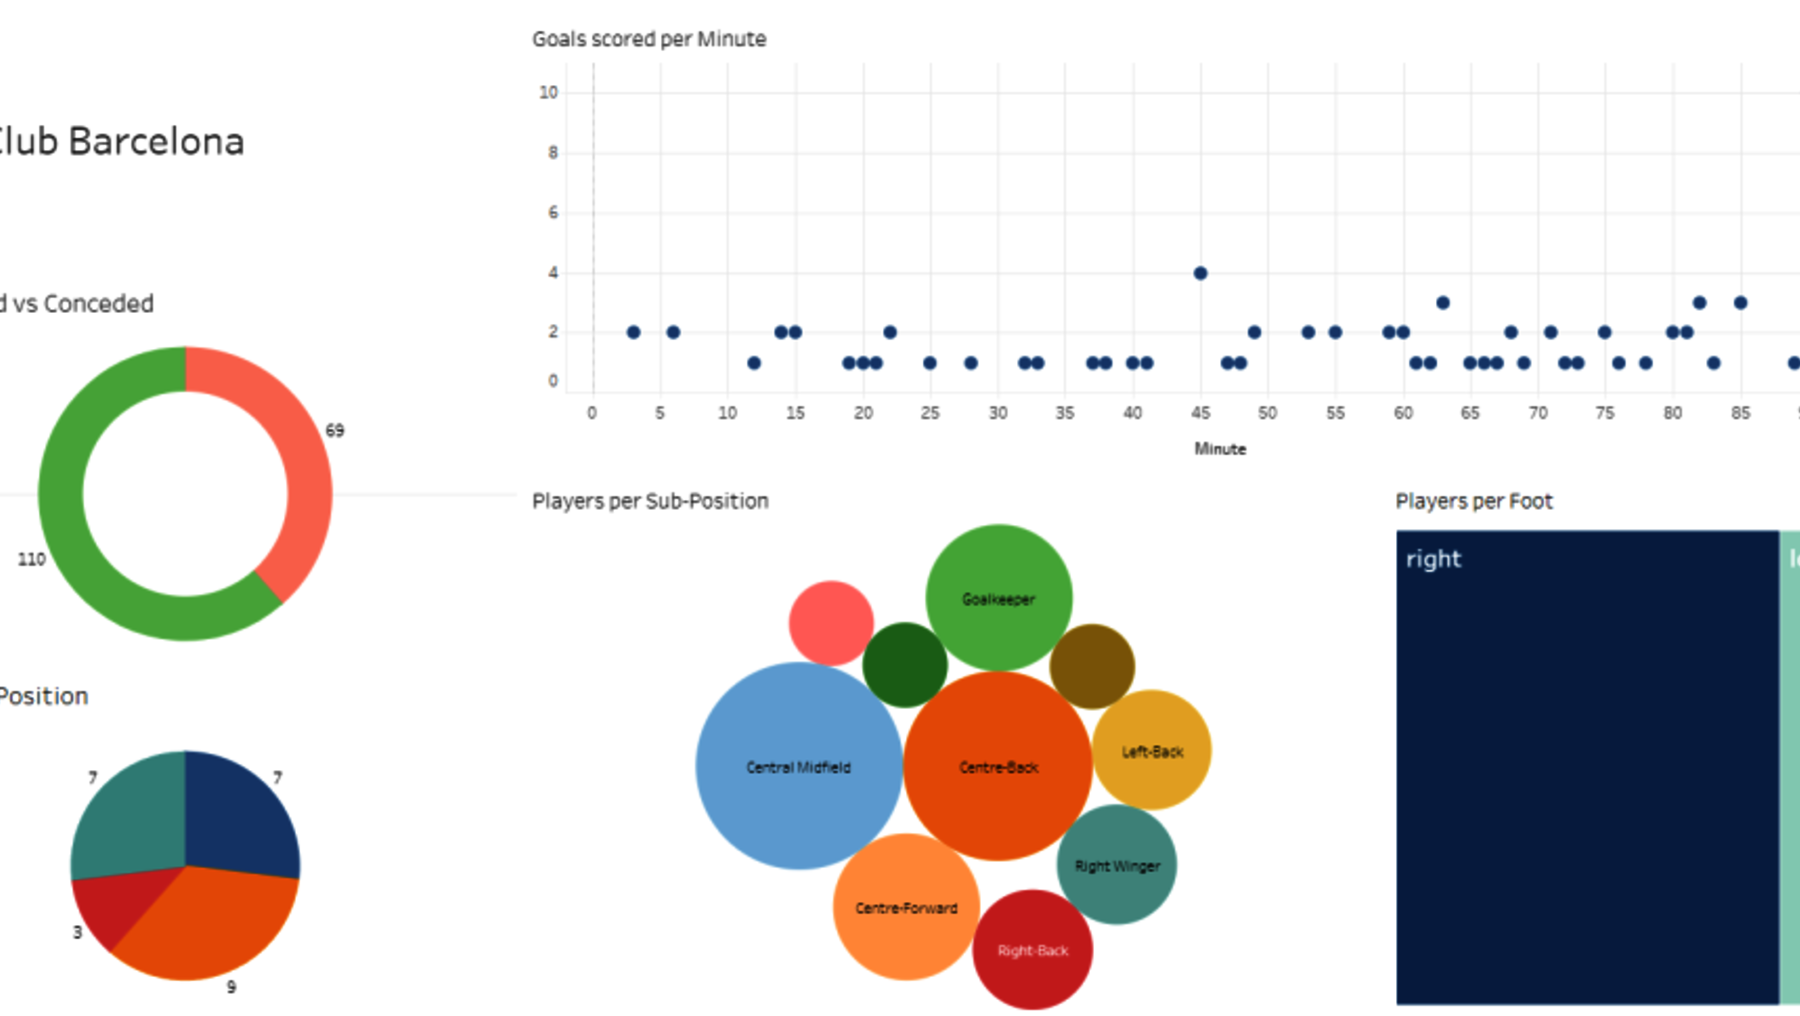
The data visualization tool Tableau was used to generate an interactive and user-friendly dashboard. The dashboard features geographic visualizations that allow users to navigate from a macro-level view of football statistics at the country level down to detailed club-specific metrics. Users can hover over a country and see the country specific metrics and can also select a country to drill down into the performance statistics of all the top-tier clubs from that country, and further explore individual club data like goals scored and conceded over the season, number of players in different positions etc. In the future, the dashboard implementation can also be extended e.g. to include player level statistics or metrics like market value development and goals scored.

